
Grafana - Visualizing Crypto Portfolio
Introduction
Section titled “Introduction”In this part of the Crypto Tracker guide, we will take what we’ve built using the Bitstamp API and stored in InfluxDB and visualize it using Grafana.
We will be using Grafana to create a dashboard that will display the current value of our portfolio, the value of each individual asset, and the percentage of our portfolio that each asset makes up.
Perhaps we will add a few more visualizations as we go along.
Prerequisites
Section titled “Prerequisites”Connect Grafana to InfluxDB
Section titled “Connect Grafana to InfluxDB”We have data, we have a database, and we’ve got an instance of Grafana running. Now we need to connect Grafana to InfluxDB. Things are starting to get exciting, so strap in, and let’s go.
Step 1: Add InfluxDB as a Data Source
Section titled “Step 1: Add InfluxDB as a Data Source”-
Navigate to the Grafana web interface in your browser.
Example:
Terminal window http://10.2.1.223:3000 -
In the Grafana dashboard, navigate Home > Connections > Data sources.
-
Click on Add data source.
-
Select InfluxDB from the list of available data sources.
-
Fill in the following details:
-
Name: Give your data source a name. For example,
Crypto-Influx. -
Query Language: Select the query language you want to use. In this case, select Flux.
-
URL: Enter the URL of your InfluxDB instance. For example,
http://10.2.1.185:8086. -
Auth: Select Basic Auth.
-
Basic Auth Details:
- User: Enter the username you set up for InfluxDB.
- Password: Enter the password you set up for InfluxDB.
-
Influx Details:
- Organization: Enter the organization name you set up for InfluxDB. Back in the InfluxDB setup, I used
bglab. - Token: Enter the token you set up for InfluxDB. If you’ve lost your token, you can generate a new one in InfluxDB fairly easily. If you’ve been following along so far, you’ll also have your token stored in your
.envfile.
- Organization: Enter the organization name you set up for InfluxDB. Back in the InfluxDB setup, I used
-
-
Click Save & Test. If everything is set up correctly, you should see a green notification that says Data source is working.
Create a Dashboard with a Simple Stat Panel
Section titled “Create a Dashboard with a Simple Stat Panel”We are starting out with baby steps here to get our feet wet with working with, and representing data in Grafana. We will create a simple stat panel that will display the current value of our portfolio.
This will not be without its complexity as we will need to write a query to sum the value of all our assets. In a later version of this app, I will add the ability to add and remove assets from the portfolio using a web interface, but for now, we will keep it simple.
Step 1: Create a New Dashboard
Section titled “Step 1: Create a New Dashboard”-
In the Grafana dashboard, navigate to Home > Dashboards.
-
Click on New Dashboard.
-
Click on Add visualization.
-
Select your data source from the list of available data sources. In this case, select
Crypto-Influx.
Step 2: Panel Orientation and Configuration
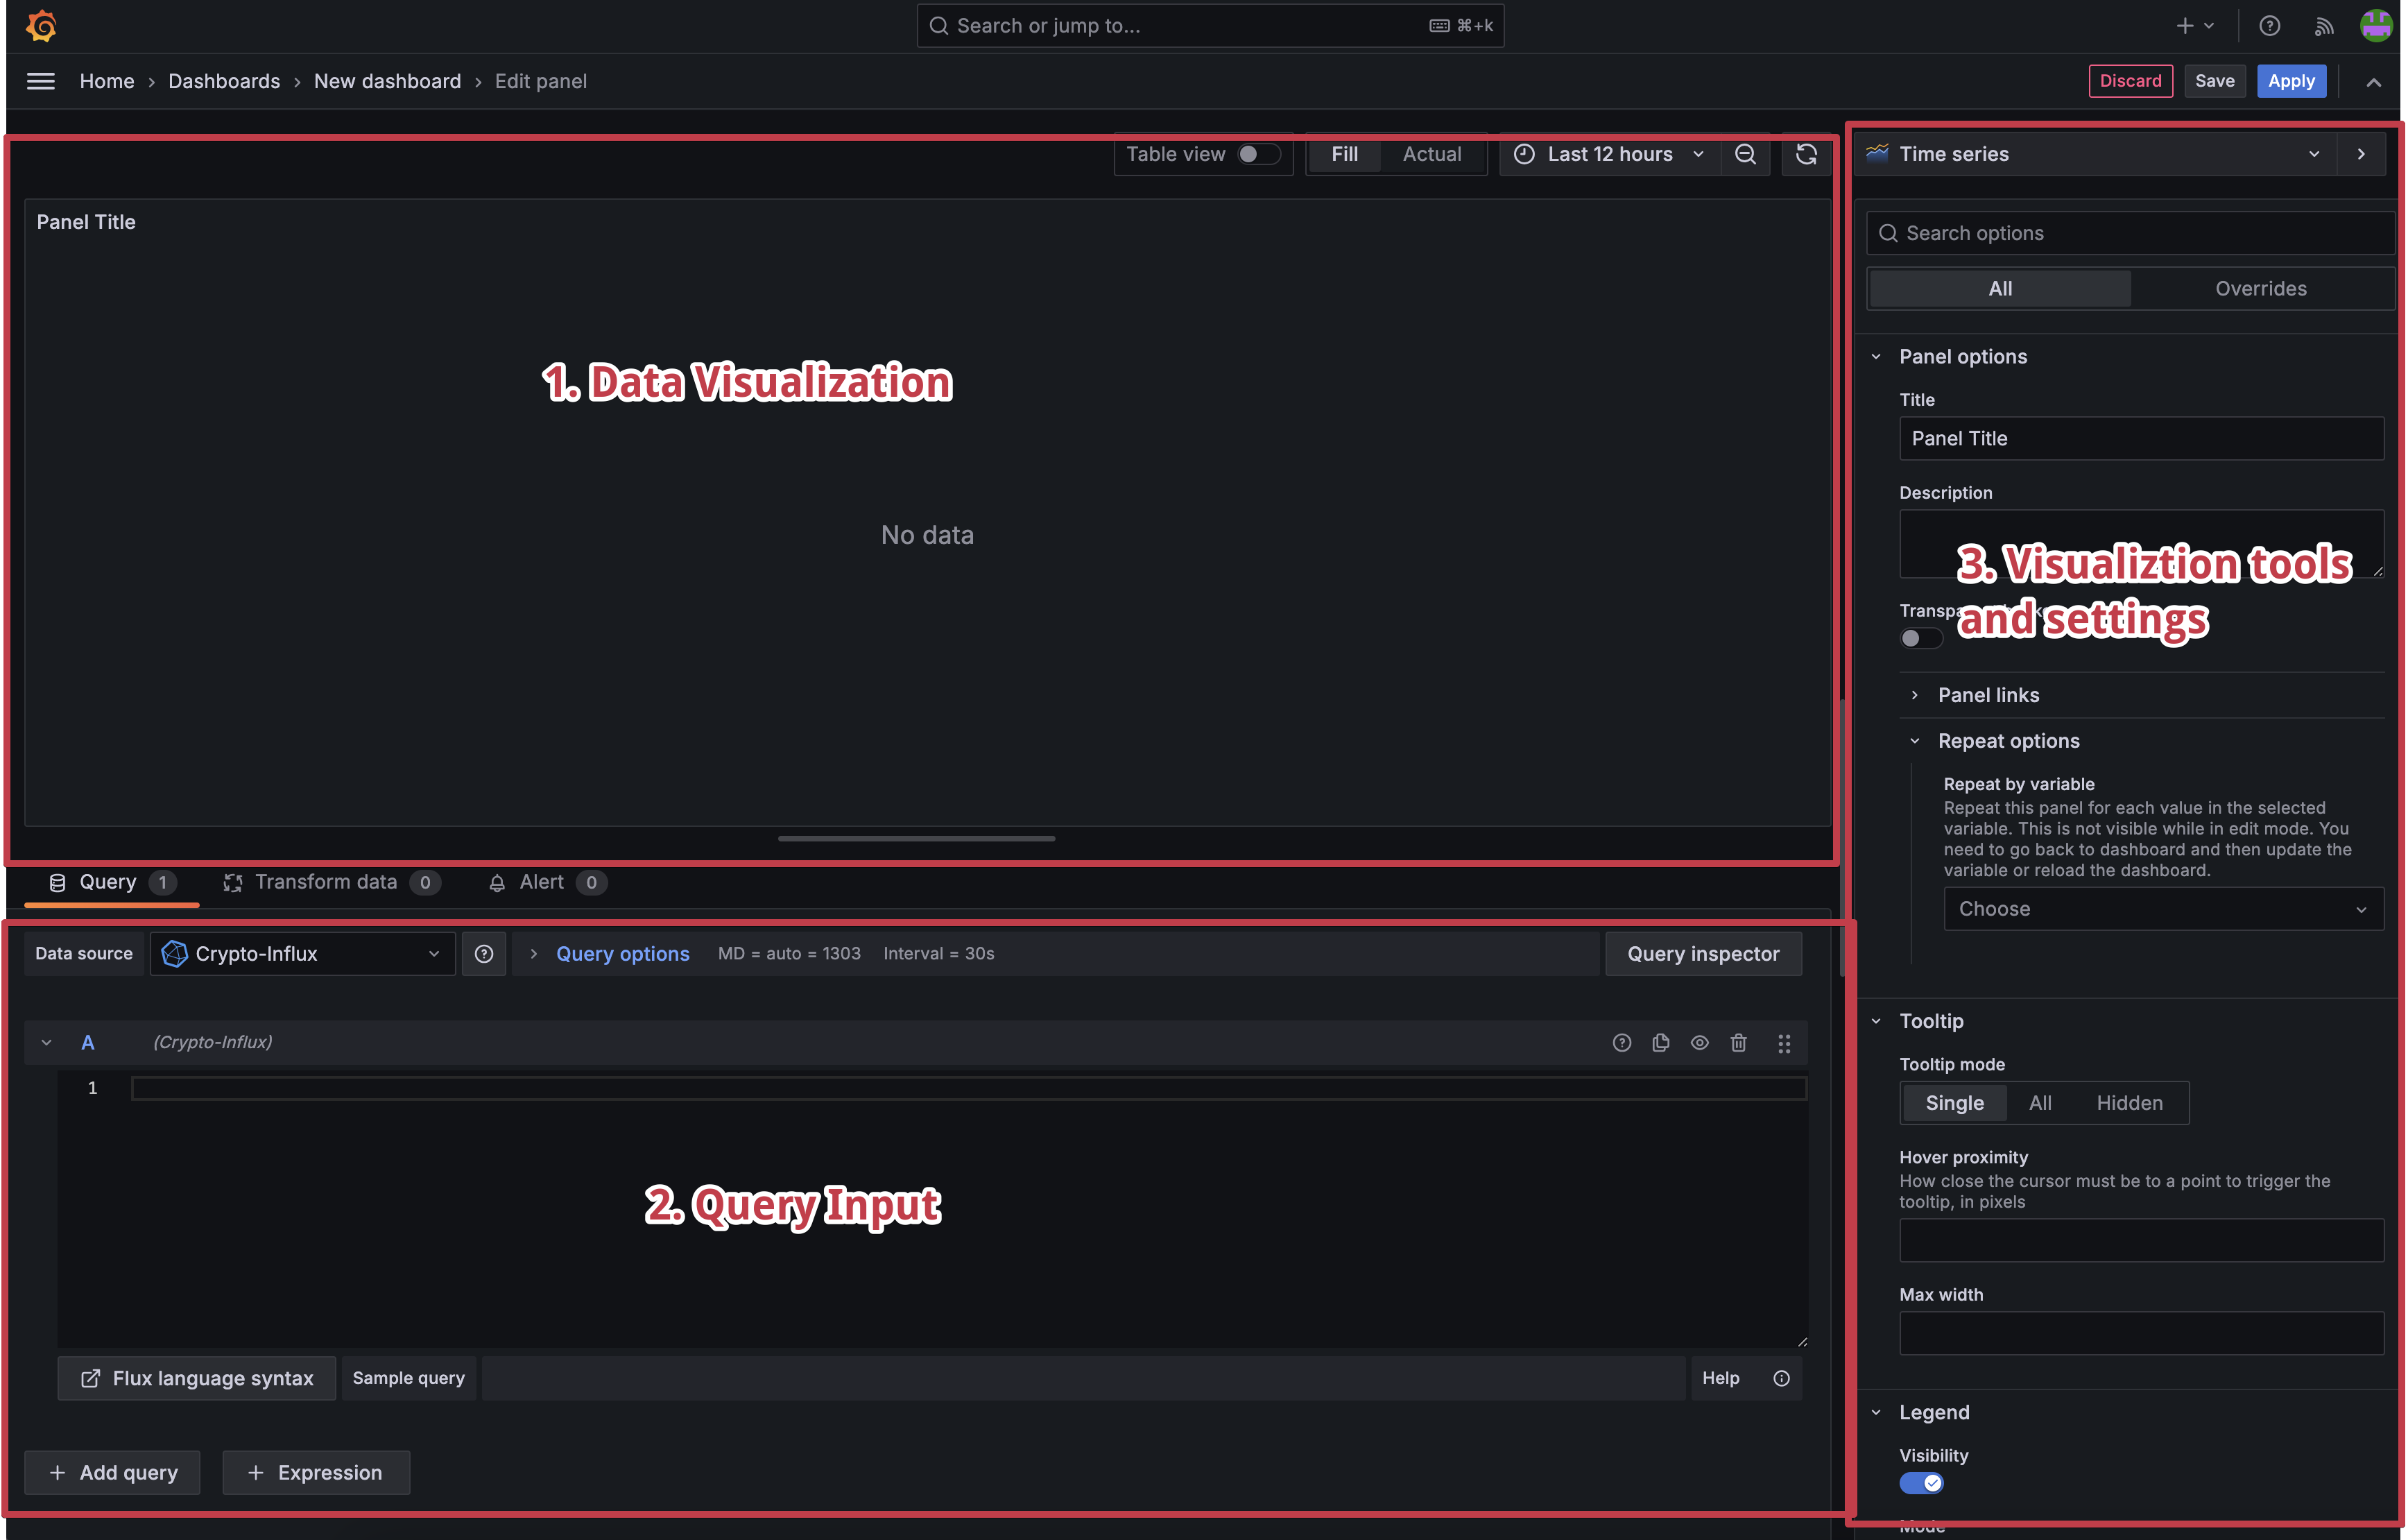
Section titled “Step 2: Panel Orientation and Configuration”There are three main sections to the panel configuration:
- Visualization Section: This is where you can view how the data is displayed.
- Query Editor: This is where we will write our Flux queries to pull data from InfluxDB.
- Panel Editor: This is where we will configure the panel itself.
Step 3 - Manual Input For Crypto Holdings using Grafana Variables
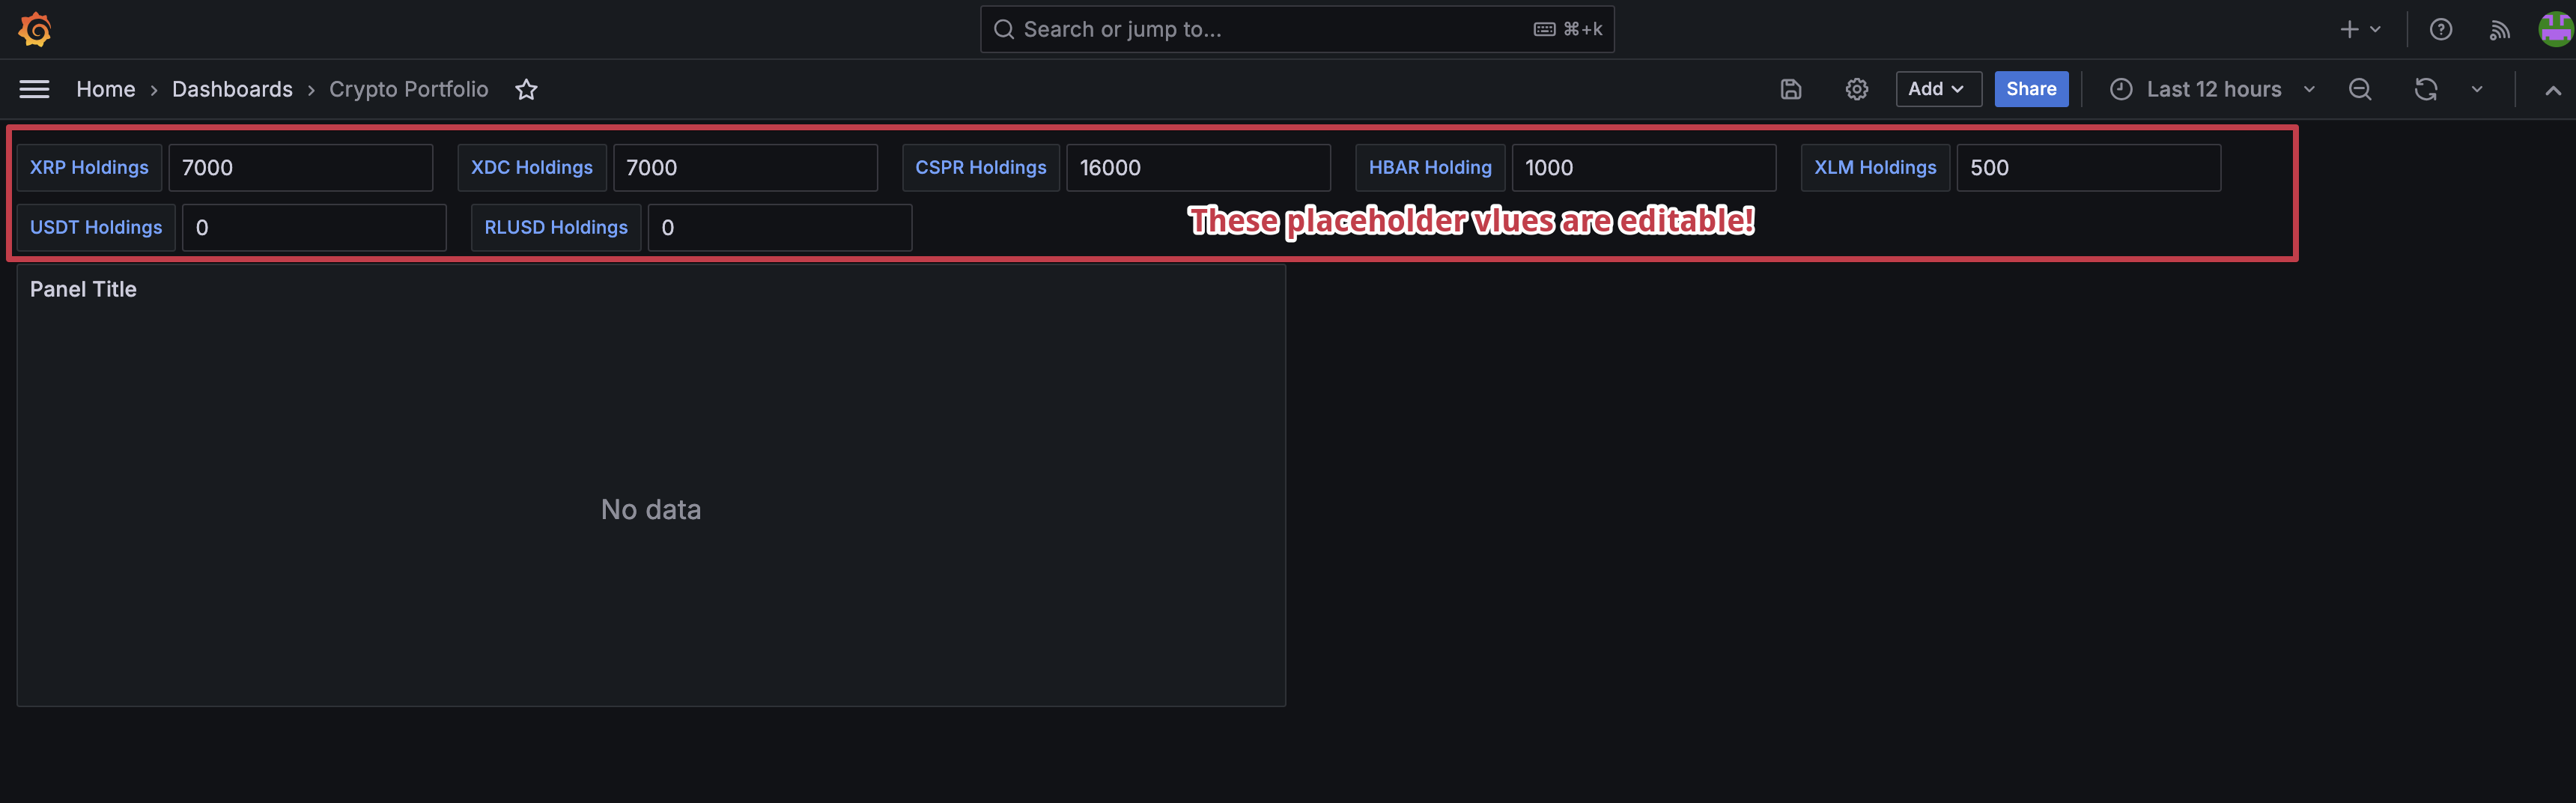
Section titled “Step 3 - Manual Input For Crypto Holdings using Grafana Variables”Since we are not yet at the point where we can add and remove assets from our portfolio using a web interface, we will manually input the value of our assets using Grafana variables.
-
Navigate in Grafana to your Crypto Tracker dashboard and click the gear icon (⚙️) to edit the dashboard.
-
Click on the Variables tab.
-
Click on New Variable.
-
We will all for the variable to be edited manually directly on the dashboard. Fill in the following details:
- Select variable type:
Text Box - Name:
xrp_holding - Label:
XRP Holdings - Description:
The total number of XRP currently held in the portfolio across all wallets and exchanges - Show on dashboard:
Label & Value - Default value:
7000
- Select variable type:
-
Click Apply and then Save dashboard.
6 Repeat the process for each asset you hold (that you’ve stored in InfluxDB). Once complete, you should see something like this:
Step 4 - Write a Query to Sum the Value of All Assets
Section titled “Step 4 - Write a Query to Sum the Value of All Assets”-
Click on the Add Query button in the Query Editor.
-
Add in the following query and then expand the details below to get an in-depth explanation of what we are doing:
import "array"// Fetch the latest price for all tracked assetsprices = from(bucket: "crypto_portfolio")|> range(start: -5m)|> filter(fn: (r) => r._measurement == "crypto_data")|> filter(fn: (r) => r._field == "price")|> group(columns: ["currency_pair"])|> sort(columns: ["_time"], desc: true)|> limit(n: 1)// Define holdings as a separate tableholdings = array.from(rows: [{currency_pair: "xrpusd", holdings: ${xrp_holdings}},{currency_pair: "xlmusd", holdings: ${xlm_holdings}},{currency_pair: "xdcusd", holdings: ${xdc_holdings}},{currency_pair: "hbarusd", holdings: ${hbar_holdings}},{currency_pair: "csprusd", holdings: ${cspr_holdings}}])// Join prices with holdings based on currency_pairportfolio = join(tables: {prices: prices, holdings: holdings},on: ["currency_pair"])|> map(fn: (r) => ({r withusd_value: r._value * float(v: r.holdings) // Cast holdings to float}))// Sum up the USD portfolio valueportfolio|> group()|> sum(column: "usd_value")**Query Explanation**
Let’s get a precise and detailed understanding of what we are doing in this query.
Section titled “Let’s get a precise and detailed understanding of what we are doing in this query.” -
Click Apply and then Save dashboard.
Step 5 - Create a Stat Panel and Configure the Output
Section titled “Step 5 - Create a Stat Panel and Configure the Output”Ok, we’ve got our query and if you run it, you might not see anything yet. That’s because we haven’t configured the panel to display the output of the query.
-
First, to ensure we are getting the correct output. It’s nice to see that we are getting something resembling the correct output. Click on the Visualization tab and select Stat. You should see your portfolio value displayed in the panel unformatted.
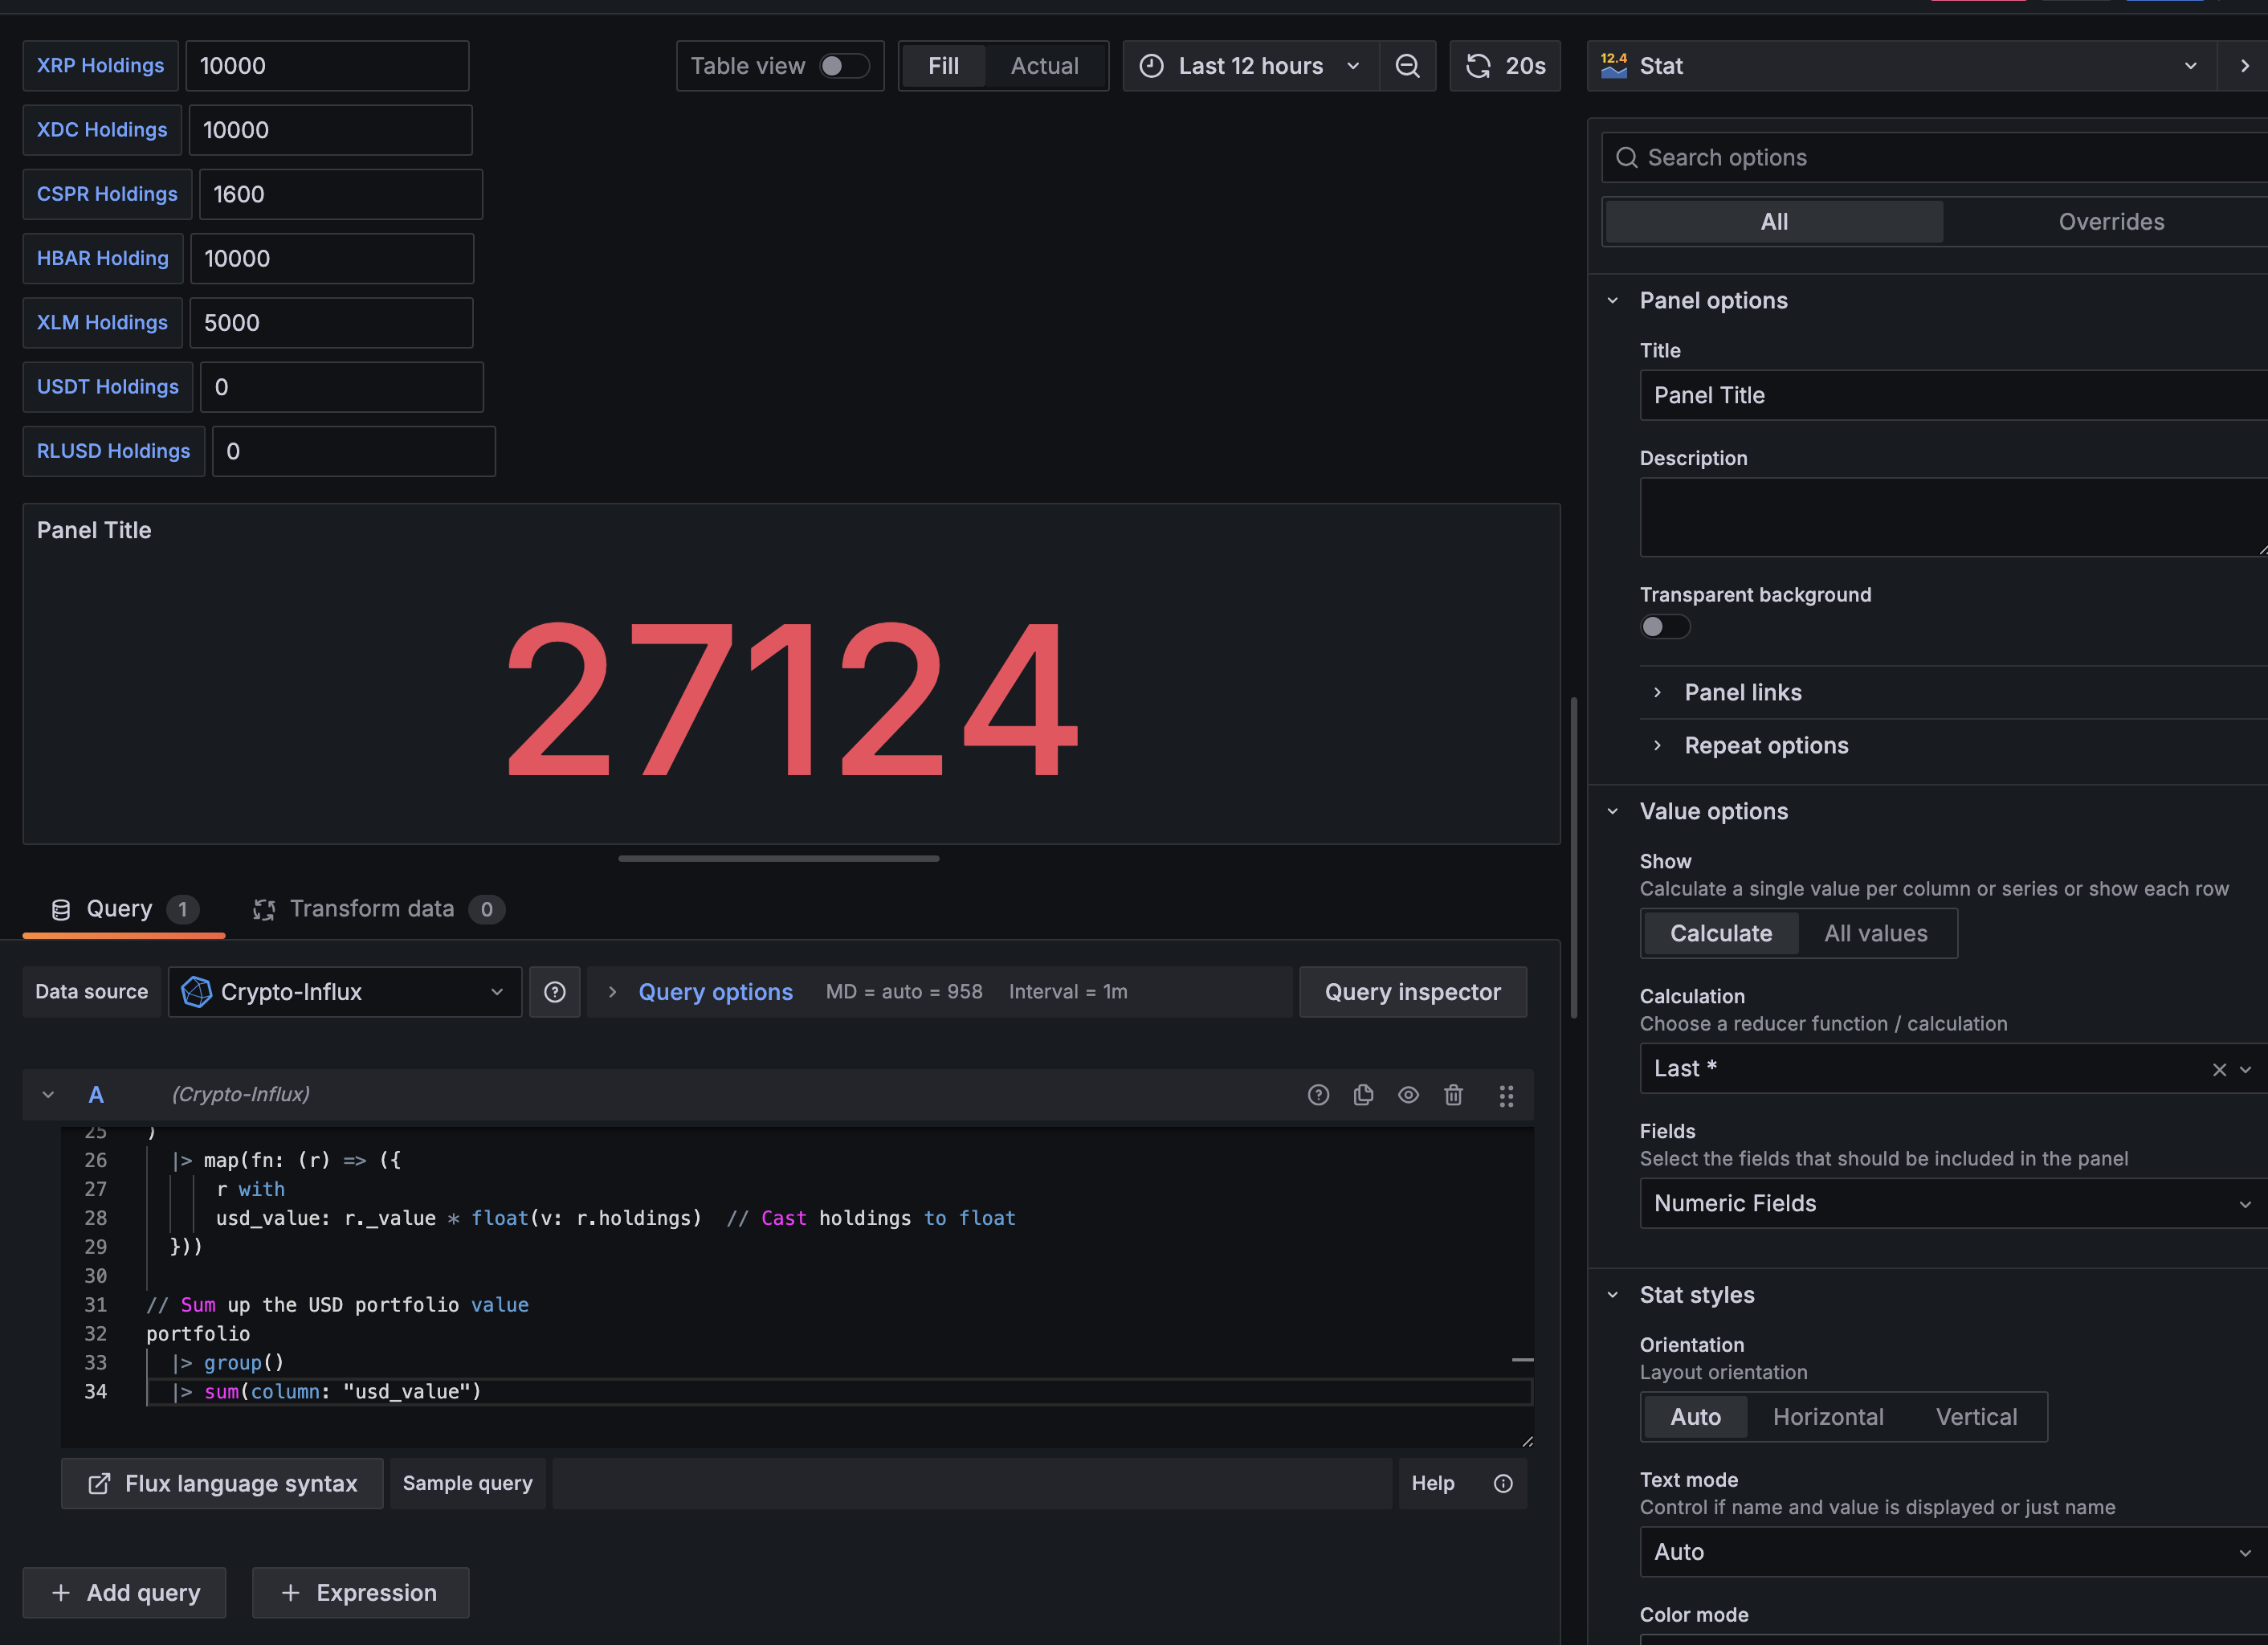
A pretty boring panel, but it’s a start.
-
Let’s add a few details to the Panel and give it a bit of life. First enter something for Panel Title. Give it a name like,
Portfolio Value. You can also add a Description if you like. -
Scroll down to the Stat styles section. Here we are going change the Text Mode to value and name. This will display the value of the portfolio and the name of the panel. This seems to uglify the panel a bit but there is a very specific reason for this. See notes below.
-
Before we affix the
$to the stat value we need to handle a few other things. Notice that when we select value and name we’ve effectively brought in our raw value from InfluxDB – we now see ausd_valuedisplayed as thenamevalue. Not great. Scroll down to the Standard Options section and enterPortfolio Value in USDin the Display Name field. This will replace theusd_valuewithPortfolio Value in USD. Looks better already. -
Add the $ to the Stat Value: Scroll to the bottom of the panel configuration and click on Add Field Override. Select Field with type as the option and then click Add override property.
-
In the list that populates for override properties, select Standard Options > Unit. Enter a custom value as a prefix in the field -
prefix: $. You should now see a $ prepended to your portfolio value.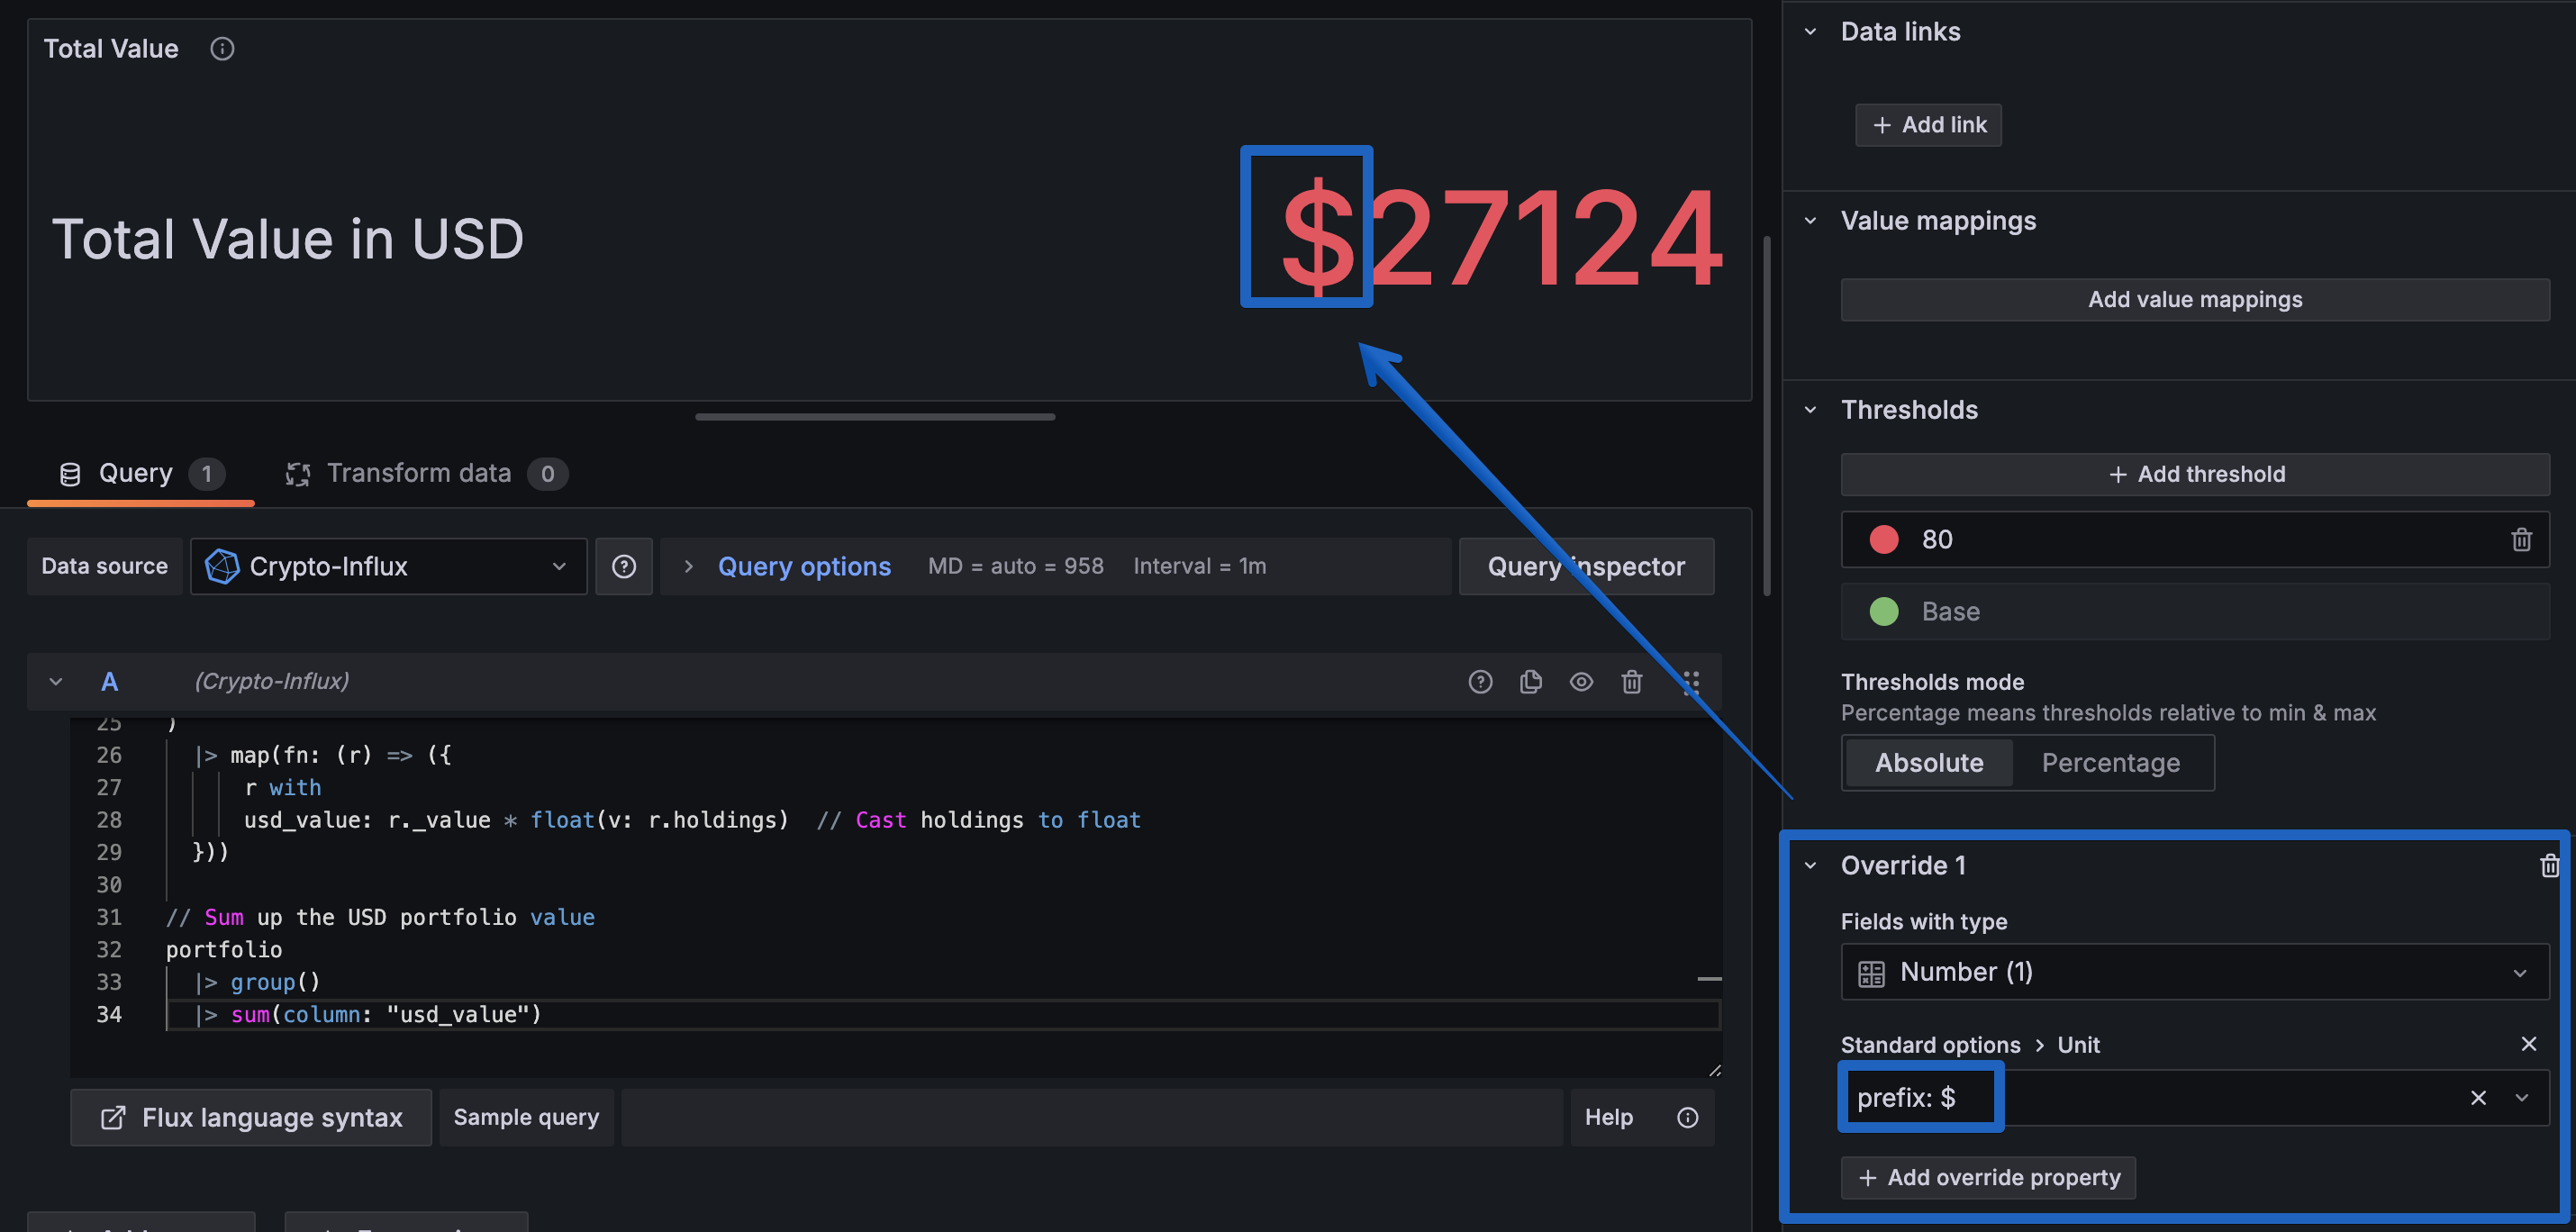
Great, we have something resembling a dollar value for our portflio. A few more minor adjustments and we will have it looking just as we need.
-
Scroll back up to the Standard Options section and look for the Decimals field and enter
2. This will round our value to 2 decimal places to get our ¢ value. (this is optional, but makes … cents to me). -
Finally, our crypto haul is showing in red. This is due to the default threshold value setting being 80 – so I guess if you were building a dashboard to monitor resource usage of a server, over 80 would be a bad thing. In our case, we are going to be (hopefully) displaying our profits which is typically shown in green. In the thresholds section, simply click the trash icon beside the 80 value to remove it.
- Click Apply and then Save dashboard.
You should now have a nice panel showing the current value of your portfolio. We aren’t done yet, as we want some more information on all our assets.
Create a Panel to Display Individual Asset Values and Percentages
Section titled “Create a Panel to Display Individual Asset Values and Percentages”We’ve got our portfolio value displayed, but we want to see the value of each individual asset and the percentage of our portfolio that each asset makes up.
Step 1: Create a New Panel
Section titled “Step 1: Create a New Panel”-
Click on the Add Visualization button in the dashboard.
-
In the Flux Query